
Presenting a Complete List of the 509 Active U.S. Ski Areas
Built on a less-maddening platform | 2024-25 season preview, part 1


Counting ski areas is harder than it sounds. You’d think it would be like counting the number of Fudge Rounds in a box. Well it says right here there are eight of them and there are. Individually wrapped and delicious. But counting ski areas is more like counting the number of potato chips in a bag. The big chips lounge on top and are clearly chips. But this clean reality splinters as one tunnels toward the bottom. Chip integrity diminishes in both size and form, until, in the bag’s dungeon, nothing remains but grease and dust. Is each dust speck, minute but edible, a chip? Are we to reassemble the jagged components into mother chips, like grocery store paleontologists? Five minutes into this exercise, any rational person would abandon it. How many potato chips are there in a bag? It’s a stupid question and nobody cares, even if it were possible to answer.
But I have invested five years into assembling an accurate list of lift-served U.S. ski areas, even after I concluded that doing so cannonballed me into the Potato Chip Paradox: can a stable inventory of an ever-changing number of loosely related and unclearly defined items exist? Attempting to outsmart reality, I published the first draft of The Storm Skiing Journal’s Big and Amazing List of U.S. Snosportskiing Centers last year. I counted 505 of them. It was a good list. And it was accurate. For about five minutes.
Skiing changes fast. Stats change with expansions. Ski areas miss winters in low snow years. New owners show up and say “Holy shit this is hard.” Of the 505 mountains on last year’s list, only 489 actually spun lifts over the 2023-24 ski season. Most of the 16 hospitalized plan to operate this winter. So are they active ski areas or not?
It became clear right away that what I needed was not a definitive list, but a living document that could accurately reflect the known footprint of the American lift-served ski landscape at any given moment. My initial inventory lived on a Microsoft Word document, meaning that each change in skiable acreage or ownership or pass access required me to update the table, convert the document to a pdf, open it in Photoshop, and convert it to a jpg that I could embed into a Storm article. Tedious and time-consuming, yes, but I did it this way because I’m dumb and don’t know things.
But I finally figured out a better way. Or actually someone said “Hey Moron just use this thing called pivot tables” that have probably been around longer than plant life. I’ve reconfigured the Pass Tracker 5001 to act as a single source of truth for all Storm charts. Tabs at the bottom of that document lead to subordinate charts that feed directly off the master page. So when Loveland joins the Indy Pass, I just have to update the main page, and Loveland is automatically added to the Indy Pass Roster chart, and the mountain’s pass affiliations update on any table on which the ski area appears: active ski areas, independent ski areas, ski areas with aerial lifts, etc.
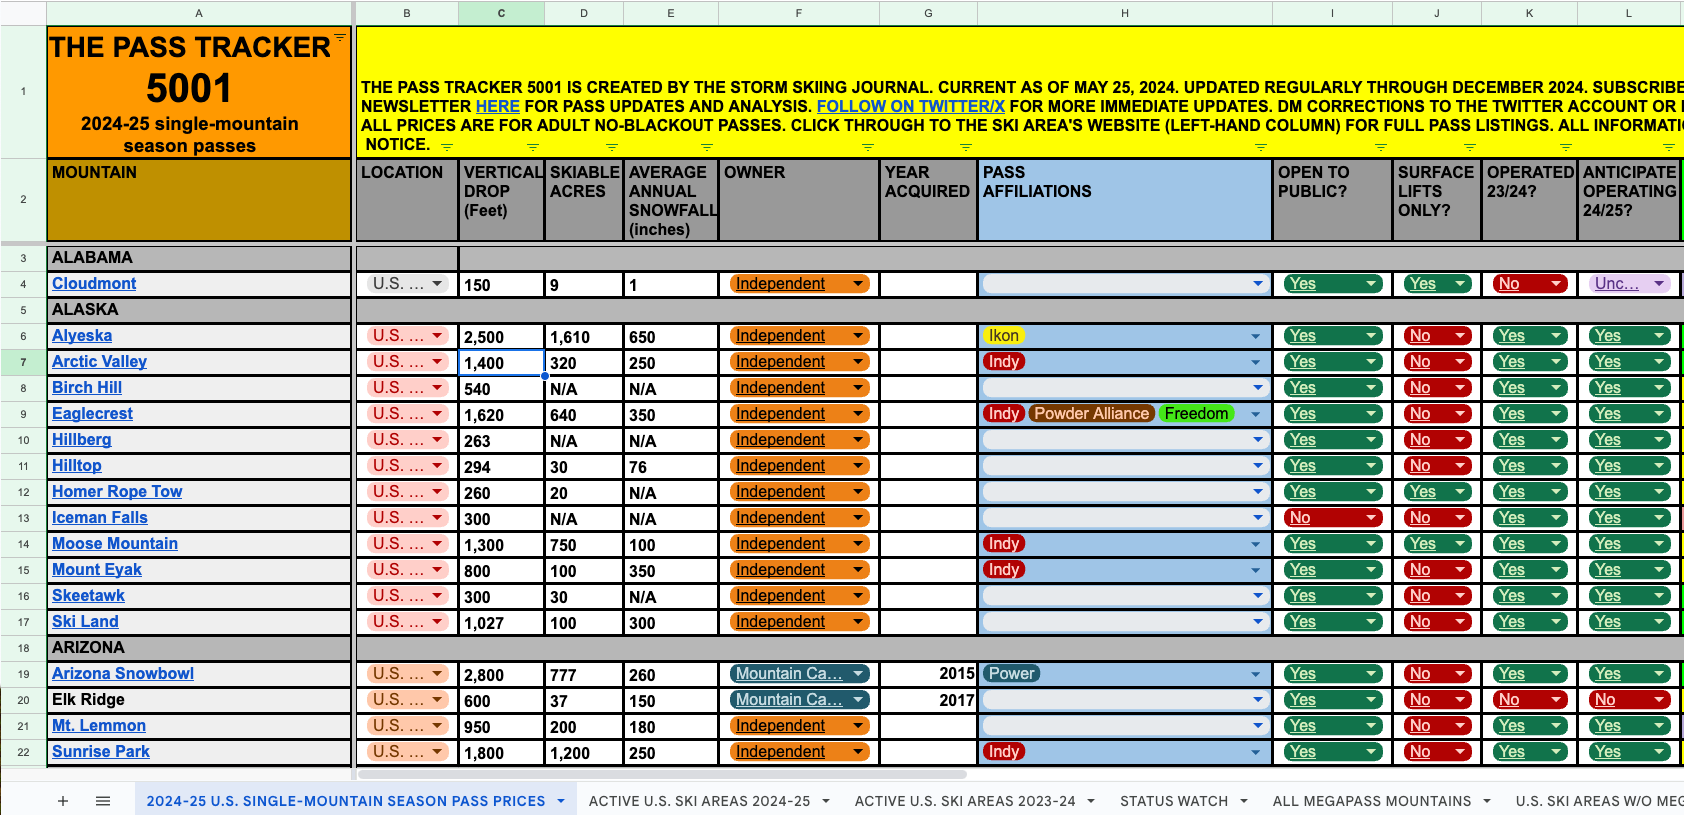
This sounds basic and it is basic but one person saying “use pivot tables” accomplished what five years of Google searches could not. Charts have become an indispensable component of The Storm, but as the variations multiplied into the hundreds their maintenance threatened to derail the entire enterprise. With this new understanding I spent the past week configuring 35 charts that hang off the pass tracker: ski areas of uncertain status, every ski area that has joined a U.S.-based multimountain pass, every U.S. ski area that has not joined a multimountain pass, private ski areas, ski areas with only surface lifts, an Ikon Pass roster, a list of every Vail-owned resort, and a whole lot more. It’s just a start. Liberated from the tyranny of constant upkeep, I can refocus on more meaningful work, confident that the foundation is stable, consistent, and accurate.
In the coming days, I’ll bore into some of the more important charts and analyze what they mean for you, your ski season, and the state of American skiing in general. But you can browse what I’ve already done in the meantime. As with any Storm resource, this is the next best version but not the final version of what I hope this will eventually be. It would be nice if users could sort data themselves, if I could figure out an easy way to add dynamic maps, if I included all of Canada (I did add the nation’s megapass mountains for the first time), if I didn’t still have to export these charts as pdfs and convert them to jpgs in Photoshop. This is, ultimately, just a Google sheet, and is stapled to the capabilities and limitations of that platform.
For now, I want to explore the most important chart aside from the Pass Tracker itself: the complete list of 509 lift-served U.S. ski areas that I expect to be active for the 2024-25 ski season.